Instagram engagement rate calculator
This Instagram engagement rate calculator checks an influencer's real engagement before you sign them for a campaign. Paste a link to any public Instagram business or creator profile, or any YouTube channel, and compare up to 5 side by side. The calculator reads recent posts automatically, works out the engagement rate, detects the creator's niche from their last 10 posts and their country where the profile shows it, compares the rate with 2026 benchmarks and shows the top 3 posts by engagement, with their dates.
- YouTube
Engagement rate by platform
| Platform | Account | Niche | Country | Followers | Engagement rate | 2026 benchmark | Verdict |
|---|
Want to raise these numbers?
Get the social media audit template, or book a free call and I'll show you what's holding engagement back.
How to vet influencers before a campaign
Follower count tells you how many people could see a post. Engagement rate tells you how many actually react, which is what a campaign pays for. Influencer agencies and brand teams use it to shortlist creators in five steps:
- Set the campaign country. Pick it in the calculator to flag creators who aren't based in your market.
- Paste your shortlist. Add up to 5 Instagram or YouTube profiles to compare engagement rate, niche and country side by side.
- Compare with the creator's tier. Smaller accounts engage more, so judge each creator against the median for their follower count in the table below, not against a single average.
- Read the top posts. Check they are recent, on-topic for your brand and not only paid partnerships.
- Look for red flags. A rate far below the bottom quarter for the tier, or likes far out of line with comments, can mean inactive or bought followers. Look closer before you sign: engagement rate alone can't prove fake followers.
Instagram influencer engagement rate by follower tier (2026)
| Tier | Followers | Bottom quarter below | Median | Top quarter above |
|---|---|---|---|---|
| Nano | 1K–10K | 1.03% | 2.79% | 6.62% |
| Micro | 10K–100K | 0.28% | 0.97% | 3.20% |
| Mid-tier | 100K–500K | 0.24% | 0.87% | 2.72% |
| Macro | 500K–1M | 0.27% | 0.89% | 2.55% |
| Mega | 1M+ | 0.28% | 0.83% | 2.24% |
Source: IQFluence, Influencer Engagement Rate Benchmarks 2026: about 30 million active Instagram creators with 1,000+ followers, counted in September 2026, engagement = (likes + comments) ÷ followers, the same way this calculator measures Instagram. The verdict in your results compares with the brand-account average; for creators, use this table.
How to calculate engagement rate
The basic formula is the same on every platform: engagement rate = interactions ÷ audience × 100, averaged over recent posts. What changes is which interactions count and whether the audience is followers, views or impressions. The calculator above reads Instagram and YouTube automatically. For TikTok, Facebook and LinkedIn, use the formulas below with the numbers shown under each post.
| Platform | Formula | 2026 benchmark |
|---|---|---|
| (likes + comments + shares + saves) ÷ followers × 100 | about 0.45% of followers per post1 | |
| TikTok | (likes + comments + shares + saves) ÷ followers × 100, or ÷ views | about 2.5% of followers per video1 |
| YouTube | (likes + comments) ÷ views × 100 | median 3.48% long-form, 2.71% Shorts2 |
| (reactions + comments + shares) ÷ followers × 100 | about 0.13% of followers per post1 | |
| (reactions + comments + reposts) ÷ impressions × 100 | about 5.2% of impressions per post3 |
Worked example
An Instagram creator with 25,000 followers posts five times. Those posts get 3,000 likes, 150 comments, 100 shares and 250 saves in total. That's 3,500 interactions ÷ 5 posts = 700 per post. 700 ÷ 25,000 × 100 = 2.8%, about six times the 2026 brand average.
What is a good engagement rate?
Compare against the benchmark for the same platform, calculated the same way. As a rule of thumb, double the benchmark is strong and under half of it needs work. Smaller creators usually have higher rates than big accounts because their audience is closer to them, so compare with accounts of a similar size, like the creators in my creator database.
How to raise your engagement rate
- Hook in the first line or first second. Most people decide to stop scrolling in a moment.
- Post formats people save and share: carousels with useful steps, short how-to videos, checklists.
- Ask one clear question and reply to every comment in the first hour.
- Post consistently on fewer platforms rather than rarely on many. My content calendar template helps.
- Audit what already works: find your top and bottom posts with the social media audit template.
Sources: 1 Socialinsider, 2026 Social Media Benchmarks (brand accounts, engagement by followers). 2 OverseerOS, YouTube Benchmarks 2026 (2,251 videos, likes + comments ÷ views). 3 Socialinsider, LinkedIn Benchmarks 2026 (engagement by impressions).
More digital tools
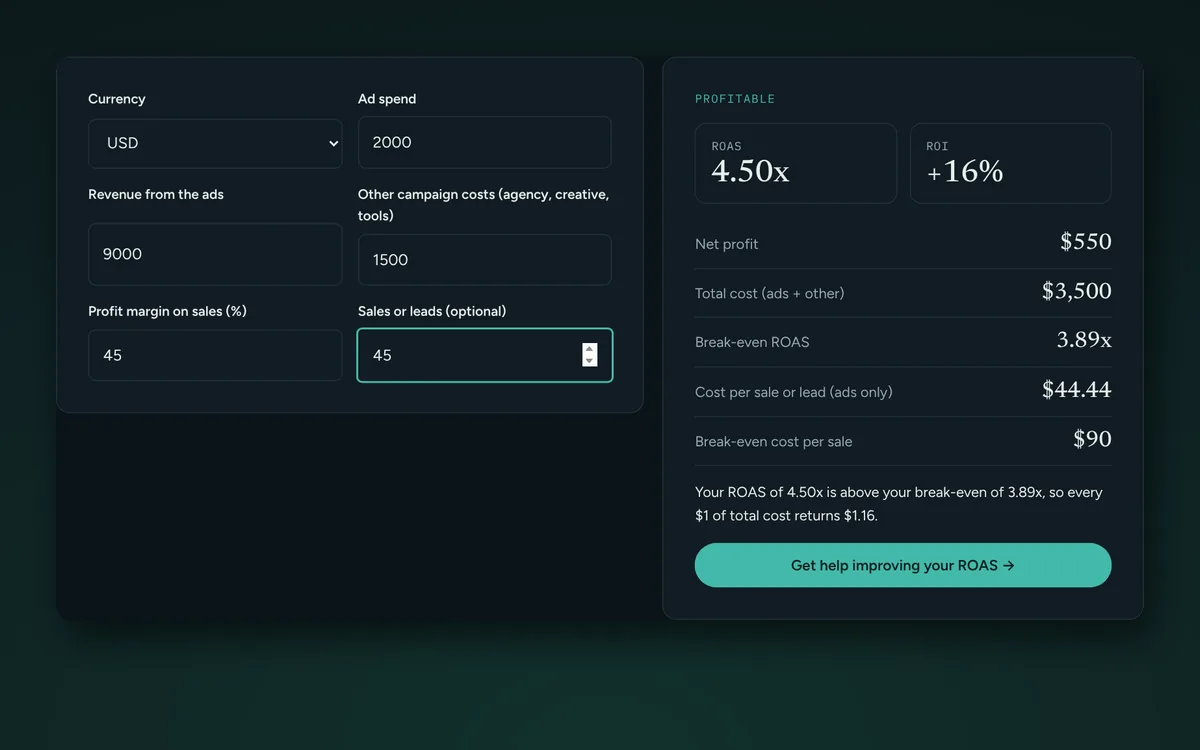
ROI & ROAS calculator
Enter ad spend, revenue, other costs and margin to see ROAS, true ROI, net profit and the break-even ROAS you need to stay profitable.
Calculate ROI and ROAS →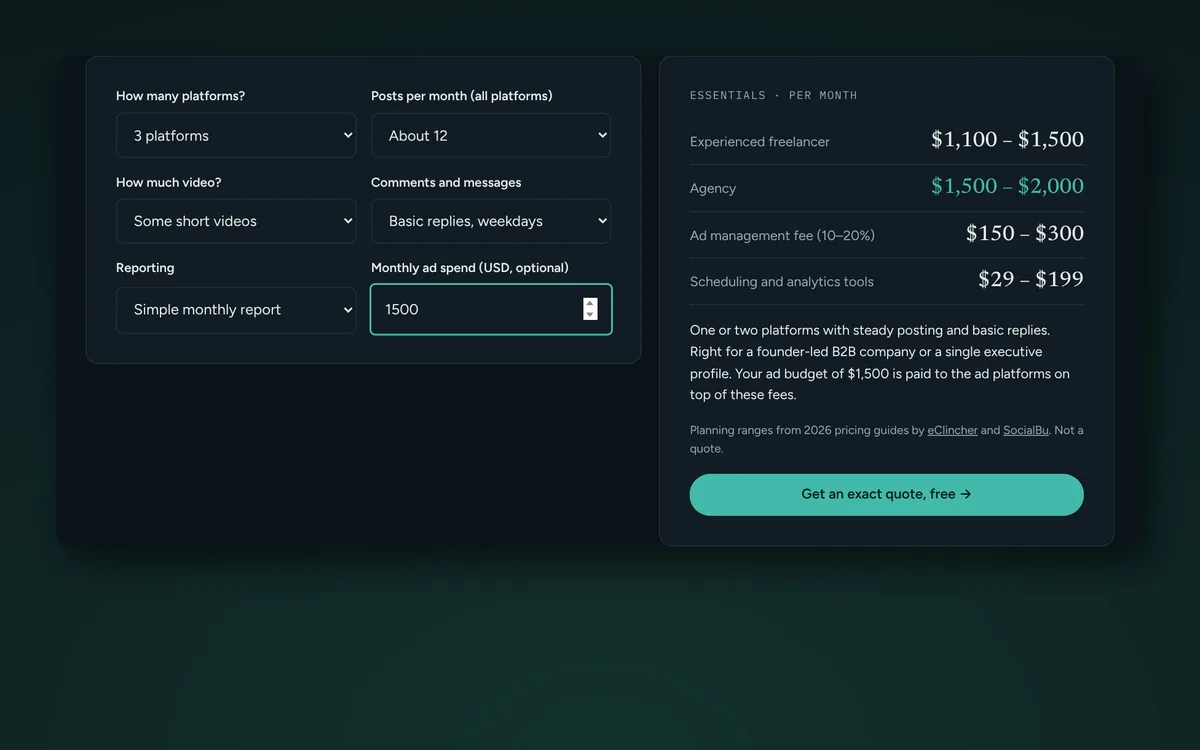
Social media budget calculator
Answer six questions to see what social media management should cost per month with a freelancer or an agency, plus ad fees and tools.
Estimate your budget →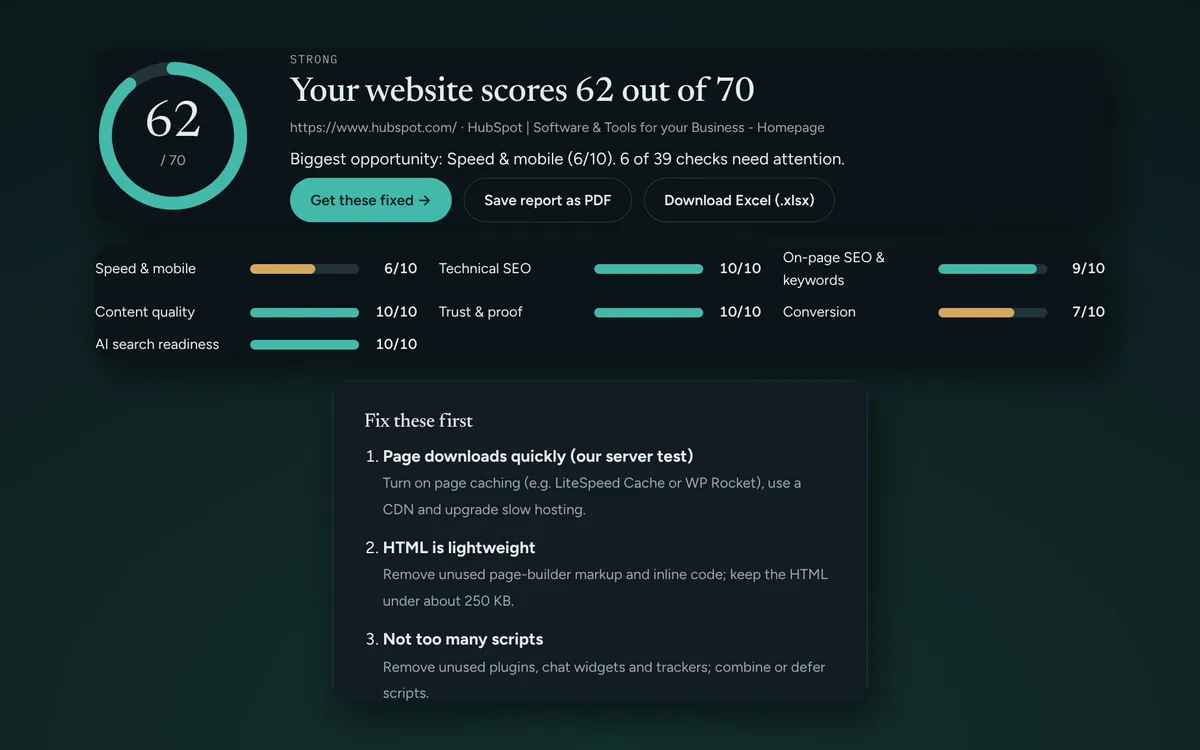
Website audit tool
Enter any website for a score out of 70 across speed, SEO, content, trust, conversion and AI search, its top 3 keywords and fixes in priority order.
Audit a website →Influencer engagement rate questions
What is a good engagement rate for an Instagram influencer?
It depends on audience size. IQFluence's 2026 benchmarks (likes plus comments divided by followers, about 30 million active creators) put the median at 2.79% for nano influencers (1K to 10K followers), 0.97% for micro influencers (10K to 100K), 0.87% for mid-tier (100K to 500K), 0.89% for macro (500K to 1M) and 0.83% for mega influencers (1M+). Above the top-quarter mark for its tier is strong.
How do I check an Instagram influencer's engagement rate?
Paste the link to their public Instagram business or creator profile above. The calculator reads their recent posts, averages likes plus comments, divides by followers and compares the result with 2026 benchmarks. To do it by hand, add likes and comments on their last 10 posts, divide by 10, divide by followers and multiply by 100.
Can engagement rate show fake followers?
It is a warning sign, not proof. An engagement rate far below the bottom quarter for the account's size, or likes that are huge compared with comments, can mean inactive or bought followers. Check those accounts more closely, for example their follower growth and comment quality, before you sign them.
Can I compare several influencers at once?
Yes. Add up to 5 Instagram or YouTube profiles and the results table shows each one's engagement rate, niche, country and verdict side by side. You can download the comparison to Excel for your campaign shortlist.
What is a good YouTube Shorts engagement rate?
Measured as likes plus comments divided by views, OverseerOS's 2026 study found a median of 2.71% for Shorts, compared with 3.48% for long-form videos.
How do you calculate engagement rate?
Add up a post's interactions (likes, comments, shares and saves), divide by the account's followers, and multiply by 100. For video on TikTok or YouTube you can also divide by views instead of followers. Average it over several recent posts for a fair number.
What is a good engagement rate on Instagram?
Socialinsider's 2026 benchmarks put the average Instagram engagement rate per post at about 0.45% of followers for brand accounts. Anything above roughly 1% is strong; creators with smaller, loyal audiences often score higher.
What is a good engagement rate on TikTok?
By followers, Socialinsider's 2026 benchmarks report about 2.5% per video for brand accounts. TikTok engagement is often measured by views as well, which gives a different number, so compare like with like.
What is a good engagement rate on YouTube?
Measured as likes plus comments divided by views, an OverseerOS study of 2,251 recent videos found a median of 3.48% for long-form and 2.71% for Shorts in 2026. The top quarter of long-form videos scored above 4.91%.
What is a good engagement rate on Facebook?
Facebook rates are low: Socialinsider's 2026 benchmarks show about 0.13% of followers per post for brand pages. Above 0.3% is well above average.
What is a good engagement rate on LinkedIn?
LinkedIn is usually measured by impressions: Socialinsider's 2026 LinkedIn benchmarks report about 5.2% (reactions, comments and reposts divided by impressions). Only the post's author can see impressions, so for other people's posts use followers instead.
How does the calculator detect a creator's niche and country?
The niche comes from the creator's last 10 posts: captions on Instagram, and titles, tags, descriptions and YouTube's own topic tags on YouTube. The country comes from the country a YouTube channel lists, or from a flag, country or city mentioned in the Instagram bio. If neither shows a country, the result says so.
Which platforms does the calculator support?
It reads Instagram (public business and creator accounts) and YouTube automatically. TikTok, Facebook and LinkedIn don't offer a free, permitted way for a website to read other accounts' posts, so use the formulas in the table on this page with the numbers shown under each post.
Should I calculate engagement rate by followers or by views?
Use followers to compare accounts and to judge how loyal an audience is. Use views (or reach) to judge how well a single post or video performed with the people who actually saw it. Always compare numbers calculated the same way.
One practical tactic every week
The Attention Brief: AI-powered content, B2B pipeline and PR tactics you can use the same day. Five minutes to read.